Find a combination of content on udder scores, body condition scores, and frame scores below.
Udder quality represents one of the most important convenience traits in commercial beef production. Cows with good udder quality not only take less labor but also may have improved longevity due to lower incidence of mastitis or injury.
Udder quality represents one of the most important convenience traits in commercial beef production. Some would argue that udder quality represents an economic trait as poor udders require additional labor inputs and thereby decrease profitability.
Seedstock producers should manage udder quality closely, says Bob Weaber, Kansas State University. “Your commercial customers expect trouble-free cattle when they make a purchase at your farm or ranch. Don’t give your customers a reason to buy genetics from another source to ‘clean up’ udders produced by your bulls.”
Cows with good udder quality not only take less labor but also may have improved longevity due to lower incidence of mastitis or injury. “Poor udders, especially large teat size, may delay timely colostrum intake by calves, resulting in poorer transmission of passive immunity,” Weaber explains.
Hereford breeders are encouraged to report udder scores to the American Hereford Association (AHA) to be utilized in genetic evaluation.
In July 2008 the Beef Improvement Federation (BIF) adopted a two-score system for evaluating udders. The AHA Board of Directors followed suit and adopted the same system during its August 2008 meeting.
Udder and teat quality are two of the most important functional traits. Udder and teat soundness are a concern for a number of reasons:
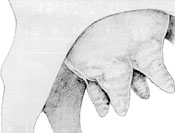
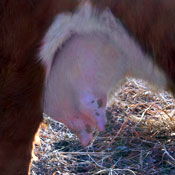
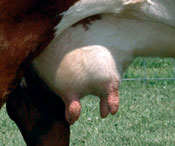
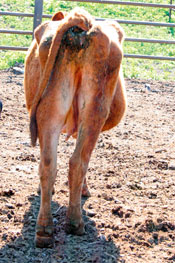
Scores range from 9 (Very Small) to 1 (Very Large, balloon shaped) and are subjective assessments of teat length and circumference. Oversized teats are difficult for newborn calves to nurse and the calf may not receive adequate colostrum, which could lead to a higher incidence of scours or decreased immunity levels in the newborn calf. In Canadian studies, cows with more desirable teat scores had calves that nursed sooner after birth.
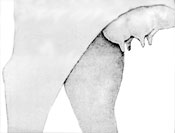
Very Small
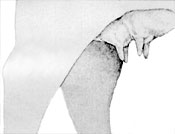
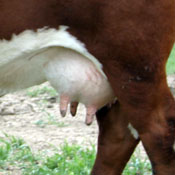
Small
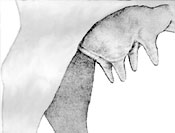
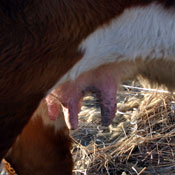
Intermediate/Moderate
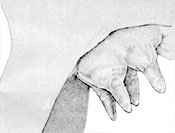
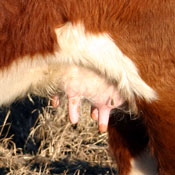
Large
Very Large/Balloon Shaped
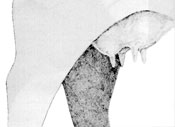
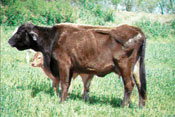
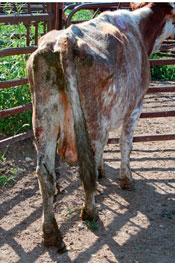
Scores range from 9 (Very Tight) to 1 (Very Pendulous) and represent assessments of udder support. Weak udder suspension results in pendulous udders that make it difficult for a calf to nurse. Weak suspension in the udder indicates a lack of support in the ligament that ties the udder to the cow’s body wall. Over time, weakness in this ligament will allow the udder to hang down too far from the body and may subject the udder to serious problems and increased potential for injury.
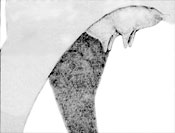
Very Tight
Tight
Intermediate/Moderate
Large
Very Large/Balloon Shaped
Udder and teat scores should be taken (on the weakest quarter) within 24 hours of calving. Scores should preferably be taken by the same person throughout the calving season.
With this system, producers score both teat size and udder suspension. The scores for both characteristics range from 1 to 9.
A two-score system allows independent evaluation of teat size and suspension characteristics. While there is a general trend for cows with large teat size to also have poorer suspension, this is not always the case. The independent scoring of the two important udder quality traits allows more precise measurement of each trait. Even though these scores are subjective, they’ll do a better job documenting variation in udder quality than a single-score system. When the two scores are used, the heritability estimates for each trait should be higher due to increased precision of measurement.
Producers should get in the habit of scoring udders when they collect calving ease data. Until you get comfortable with the scoring system, tape a scoring guide to your clipboard or reduce on a copy machine and tape in your ‘red book’ for use in the field. Try to get as close as you can to the guide and be as consistent as possible.
Once you do it for a while, you’ll start picking out the really good ones and really bad ones easily. Be honest with yourself and use as much of the scale as needed. If she’s a ‘1’ on suspension and ‘1’ on teat size, give the scores. Your customers expect it!

Hereford breeders record udder scores on the Registration Application/Birth Information Worksheet (Form 1).
According to Jack Ward, AHA executive vice president, with the new system, breeders will list the score in the same field used previously, but instead of recording one score, they will input the two digits. The first digit will be the udder suspension (attachment) score, and the second digit will be teat size. For example, if a cow has an attachment score of 7 and a teat size of 5, the breeder will record 75 in the “dam udder score” column.
Research shows udder and teat characteristics are heritable; thus, change can be made through selection.
Consistent and steady progress can make dramatic improvements in udder quality. Help yourself and your customers by selecting for and culling on udder quality. Improving and monitoring udder traits will pay dividends in the long run.
Udder and teat scores should be taken (on the weakest quarter) within 24 hours of calving. Scores should preferably be taken by the same person throughout the calving season.
With the release of the spring 2015 Pan-American Cattle Evaluation (PACE), the AHA released two new expected progeny differences (EPDs) for udder quality. The two traits — udder suspension (UDDR) and teat size (TEAT) — were first released on the web. You can find them by going to Hereford.org and clicking on “EPD Search.” They are located in the EPD trait box positioned right after maternal cow weight (MCW).
This first release will be the trait by itself with no correlations to other traits, and there will not be a genomic impact with genomic enhanced-expected progeny differences (GE-EPDs). There were around 200,000 udder observations included in the first evaluation, and the heritability for both UDDR and TEAT is about .34, which makes this trait fairly highly heritable, so genetic progress can be made rather quickly.
The correlation between the two scores and one is .72, so it makes all udder scores useful in this evaluation. This EPD can be used the same as other EPDs and will allow you to compare animals and, most importantly, has the potential to change udder quality between sire groups. This scoring system is not concerned with milk flow or production; those will be measured with the weaning weight (WW) and milk and growth (M&G) EPDs. All we are looking at with this trait is the type of udder and teat.
Both UDDR and TEAT EPDs are reported on the scoring scale. Differences in sire EPDs predict the difference expected in the sires’ daughters’ udder characteristics when managed in the same environment. For example, if sire A has a UDDR EPD of 0.4, and sire B has a UDDR EPD of -0.1, the difference in the values is 0.5, or one-half of a score.
If daughters of sires A and B are raised and managed in the same environment, you would expect half a score better udder suspension in daughters of sire A, compared to sire B. Likewise, if sire A has a teat size EPD of 0.4, and sire B has a teat size EPD of -0.1, the difference in the values is 0.5, or one-half of a score. If daughters of sires A and B are raised and managed in the same environment, you would expect half a score smaller teat size in daughters of sire A, compared to sire B. Just like with the scoring system, the higher the EPD the better for both traits.
These are important traits to analyze because commercial producers demand genetics that are problem-free. The loss of time, longevity and calf performance due to a poor quality udder cannot be tolerated.Remember that it is important to continue to collect udder scores within 24 hours of calving — the closer to calving time, the better. It is also important to understand that there is no perfect score, but it is the ranking and the differences within the herd that are important.
Take time to collect cow weights and body condition scores at weaning to maximize conception and herd productivity.
Improved reproduction and feed efficiency are two goals all cattle producers strive to attain. They are also two of the harder goals to measure. Producers spend hours looking for ways to improve conception and herd productivity.
An easy tool available to assist producers in the evaluation process of their cow herds is body condition scores (BCS). These scores allow producers to achieve optimum reproduction level and reduce feed costs.
“Body condition scoring is an easy method to assess the nutritional status of the herd and the impact of an operation’s nutritional program,” says John Hall, Virginia Polytechnic Institute and State University Extension beef specialist. “By using body condition scoring at critical times, cattlemen can make decisions on when to supplement. Also, considerable research indicates that body condition score before calving and during the breeding season are directly related to reproductive efficiency.”
Hereford breeders are encouraged to collect and report cow weights and BCS at weaning. To be compliant with Whole Herd Total Performance Records (TPR™), producers have a seven-day window before and after weaning to collect cow weight and BCS. Hereford breeders must report both a cow weight and BCS for the data to be included in national cattle evaluation.
“This data should be collected because it will give us an opportunity to look at some cow maintenance issues, which, in turn, could be directly related to fertility and longevity,” says Jack Ward, AHA executive vice president. “We do calculate a mature weight EPD and we use this data in our current indexes.”
“This will be a trait that could really prove to be important to the genetic analysis,” he adds. “We are continually looking at ways to improve efficiency in the cow herd, and this data could be very important in finding the genetics that will make the proper changes.”
Hall has taught body condition scoring to students and producers for several years, conducting workshops and research on the subject. He says the scores are a visual estimate of body energy reserves, so a trained eye and a notebook are all that is really needed when scoring cows. He does encourage producers to utilize reference publications before starting the process.
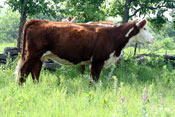
The most common BCS system ranks cows from 1-7 (See Figure 2).
Hall says for the novice, it is easier to learn the process if cattle are run through the chute and key areas of the cow are examined closely and felt. The key areas include hooks, pins, ribs, backbone and tailhead. After the cow is examined in the chute and a score is given, based on palpating the key areas, the cow should then be viewed after being let out of the chute. This final observation will help train the novice’s eye. An experienced person helping during the first body condition scoring session is a great asset, Hall adds.
“The rancher who is experienced in body condition scoring can walk, drive or ride through a herd of cows and body condition score them by sight,” Hall says. “Alternatively, the cows can be brought to a corral for easier viewing.”
For utilization in Hereford cattle evaluation, the key time to collect and record BCS is at weaning, but the process of evaluating cow BCS is something that is useful year-round. According to Hall, there are four key times to BCS cows:
“From a management perspective, 60-90 days before calving is the most important time,” Hall says. “Because of the clear relationship between BCS at calving and rebreeding success, we want to make sure cows are on target to calve in the ideal BCS. If they are too thin at this time, producers still have time to increase BCS on cows before calving.
“The second most important time to score cows is at weaning. The BCS at weaning indicates the ability of the cow to adapt to the environment or the adequacy of the nutrition program. Also, weaning BCS can be used to determine which cows need to gain weight between weaning and calving. Finally, from a genetic evaluation perspective, BCS at weaning will be used to adjust the cow body weight at weaning to estimate mature cow size,” Hall explains.
Evaluating BCS is something everyone who helps on a farm or ranch should be trained to do, but for reporting purposes, it’s best for consistency if one person scores all the cows reported to the AHA.
BCS allows producers to sort cows according to nutritional needs, thereby improving the efficiency of their nutrition program. This is possible because of the strong relationship between body condition and weight change.
Hall explains that although it is critical to have cows in good condition at calving, BCS at calving can be used to plan the nutrition program from calving to breeding. Cows that are thin at calving but gain weight from calving to breeding have increased pregnancy rates compared to cows that remain thin. BCS at the beginning of the breeding season is an indicator of breeding season success. Cows that are thin at the beginning of the breeding season will respond to increased nutrition, but the effect on pregnancy rates may be limited.
Research shows that cows in BCS 5-6 at calving and breeding will have higher pregnancy rates than cows that are in BCS lower than 5. The critical body condition for first-calf heifers is BCS 6-7.
Hall says, aside from the optimum BCS differences, there is little difference in body condition scoring first-calf heifers, young cows and mature cows. “Older cows (older than 10 years) create a unique situation because the natural ‘sagging’ of the ribs and body tends to make backbone, hips and ribs more apparent in older cows,” he says. “Cattlemen should concentrate on fat deposits in the brisket, tailhead and pins of these cows when making a BCS determination.”
Thin cows (BCS 4 and less) need to be managed to gain weight precalving and from calving to breeding in order to increase reproductive success, Hall says. Cattlemen may have to feed thin cows separately from the main herd to more economically increase BCS on these cows.
“Cows that are BCS 4 at weaning and have a large, healthy calf need only to be managed to gain weight and BCS to be at BCS 5 or 6 by calving,” he says. “Cows that are less than BCS 4 at weaning may indicate a mismatch between cow type and the ranch forage resource or an inadequate nutritional program.
“Cows that are BCS 8 or 9 before calving can be placed on lower-quality feeds or pastures and allowed to lose weight until they are BCS 6 without reducing calf vigor or subsequent reproductive performance. In contrast, cows that are BCS 8 or 9 at weaning and produced a lightweight calf at weaning are unproductive cows that may need to be culled.”
To improve body condition, Hall says there’s not a specific technique or feeding strategy; however, there are guidelines to increase BCSs.
For example if 45 days prior to calving a cow is a BCS 4, she needs to gain 1 BCS (40 to 85 lb.) in 45 days.
He encourages cattlemen to consult their local Extension specialist or nutritionist to determine the best nutrition program to fit their environment and available resources.
Research shows that failure to monitor body condition prior to key production periods can be disastrous to cow herd productivity. Take the time to collect weights and score cows each fall, and then use the data to take action and improve the productivity of your herd and your customers’ herds.
Figure 2: Dam’s body condition score reference chart
Cow is extremely emaciated. Tailhead and ribs project prominently. No detectable fat over backbone and hips.
Somewhat emaciated. Tailhead and ribs are less prominent. Backbone still sharp.
Ribs are less sharp but definable. Some fat on spine.
Ribs not obvious. Some fat over ribs and hip bones. The backbone can be identified but feels rounded, not sharp.
Good overall appearance. Palpable fat cover on the ribs.
Firm pressure needed to feel backbone. High degree of fat is now palpable over ribs and around tailhead.
Fleshy condition. Carries considerable spongy fat over ribs and around tailhead.
Very fleshy and over-conditioned. Large fat deposits over ribs and around tailhead. Backbone almost impossible to palpate.
Cow has lost definition. Hips buried in fat tissue, looks blocky. May be impaired in mobility. Bone structure no longer visible.
The following tables give current estimates of cattle height, along with adjustment equations for bulls and heifers. Values for steers are not available; however, bull height estimates may be used as approximations for steers.
(-11.548+(0.4878*HIP HEIGHT))-(0.0289*DAYS OF AGE)+(0.00001947*(DAYS OF AGE*DAYS OF AGE))+(0.0000334*HIP HEIGHT*DAYS OF AGE)
*The following equations only apply to hip heights taken when the animal is between the ages of 5 and 21 months.
(-11.7086+(0.4723*HIP HEIGHT))-(0.0239*DAYS OF AGE)+(0.0000146*(DAYS OF AGE*DAYS OF AGE))+(0.0000759*HIP HEIGHT*DAYS OF AGE)
*The following equations only apply to hip heights taken when the animal is between the ages of 5 and 21 months.