DMI Example
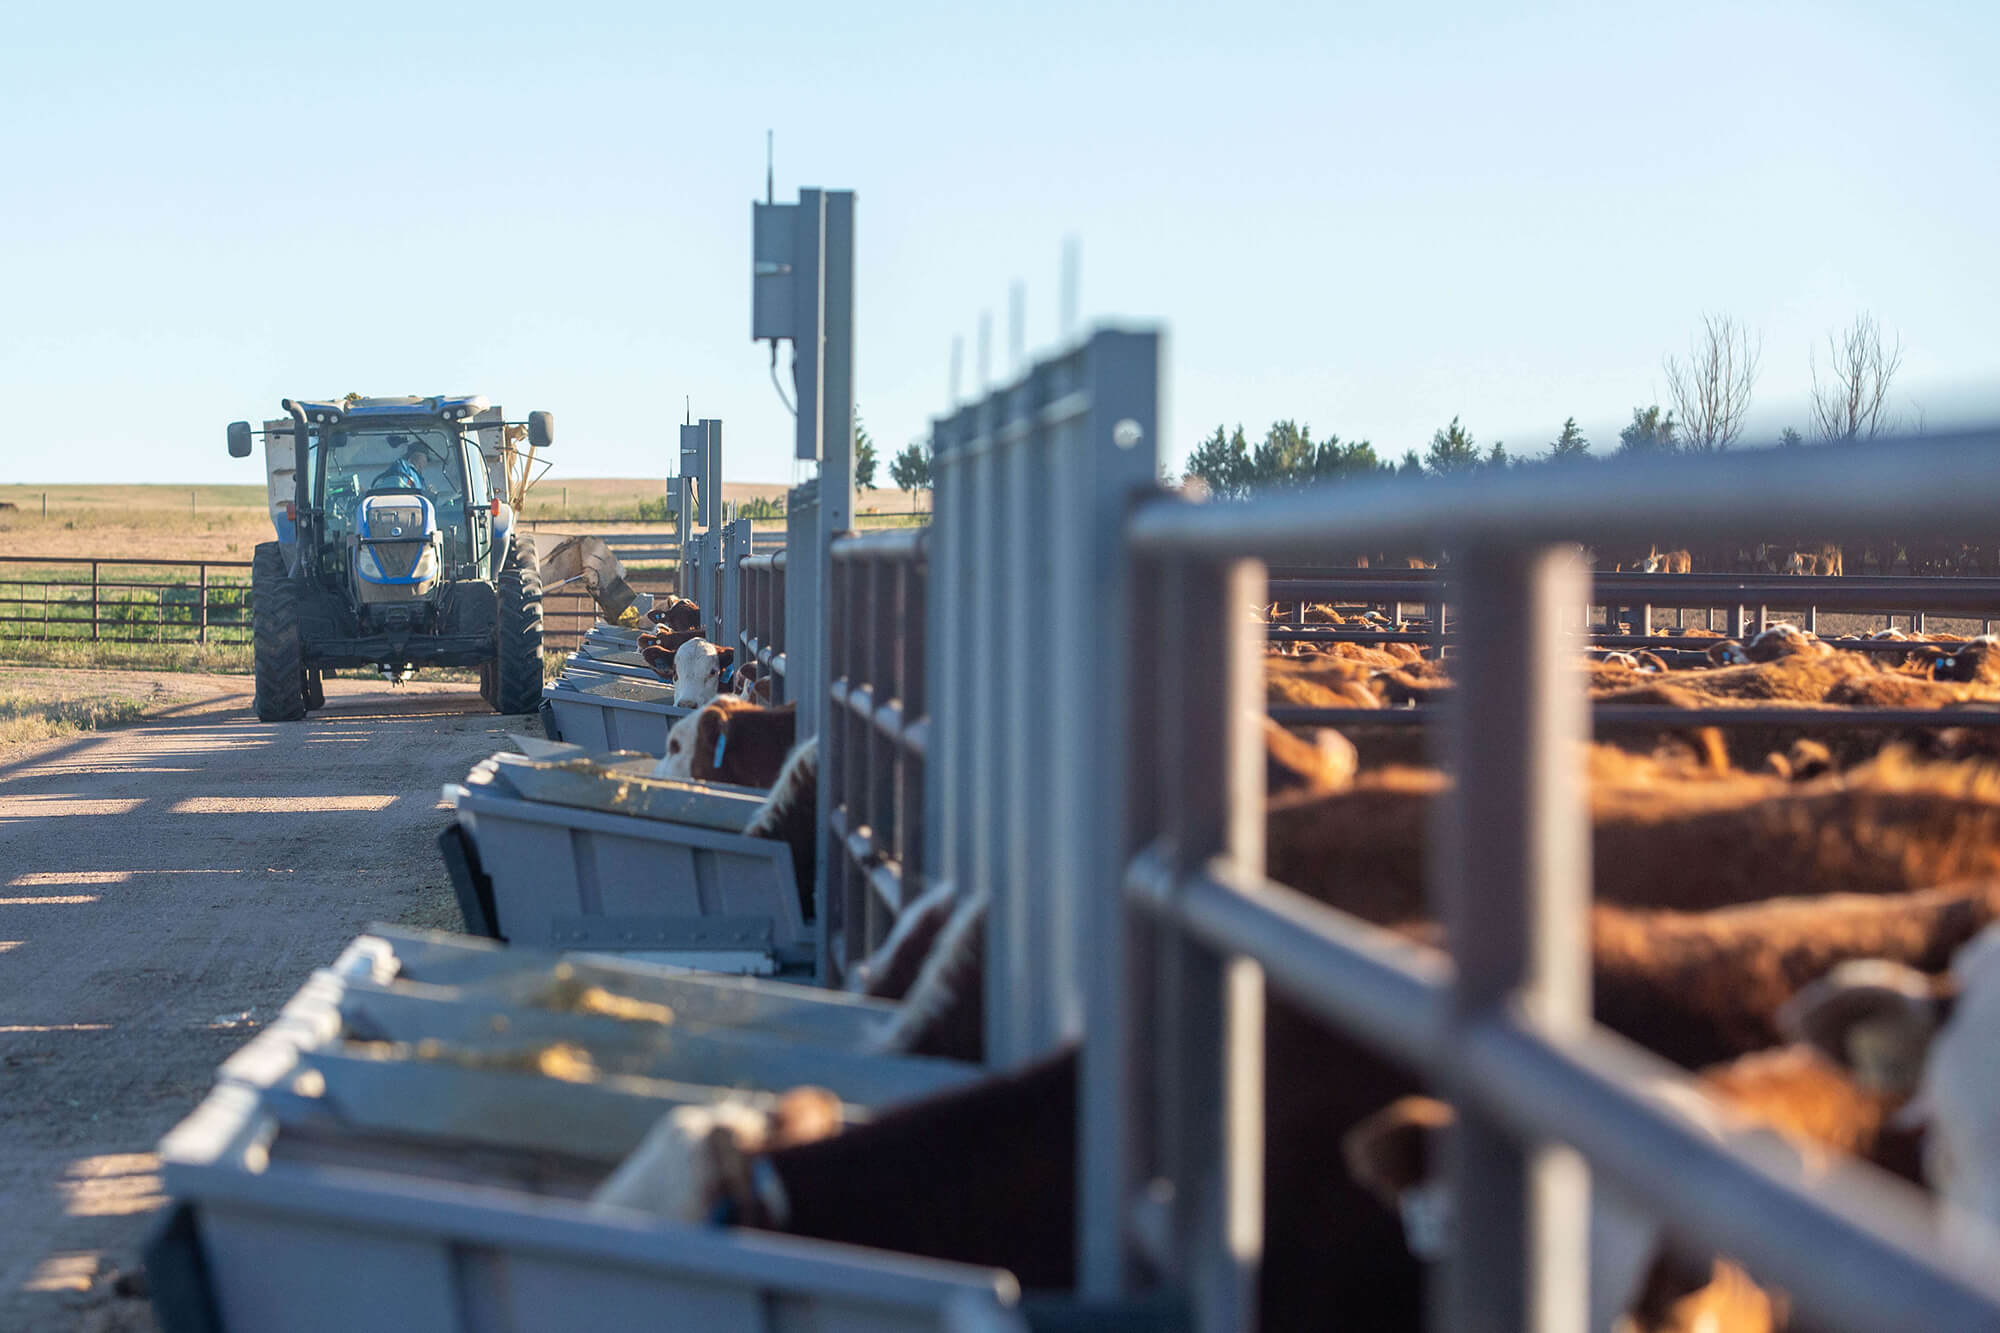
The following example depicts a comparison between two sires for their DMI EPDs. Note that a lower value is associated with genetic potential for less intake in future progeny. As with other EPDs, the difference between individuals is the best approach in understanding the DMI EPDs. In this example, the progeny of Sire A are expected to consume 0.75 pounds less feed per day compared with Sire B’s progeny. This assumes that all progeny are exposed to the same postweaning feeding management and environment. Care should be taken in the interpretation and application of DMI EPDs, with the best approach being the future use of these genetic values in AHA selection indexes.
Example DMI EPD (lb per day)
| Sire A: DMI EPD = | -0.50 lb/d |
| Sire B: DMI EPD = | +0.25 lb/d |
| Difference | -0.75 lb/d |
